
Welcome to the second half of denkbots’ meta-analysis on combat robots, Part Five: Comprehensive Sub-Type Meta-Analysis of ComBot Fights! We will be building upon our work in the first half of our analysis so take a moment to review if needed.
INTRODUCTION
We will be building upon the analysis done in Part Three, shown in Figure 3.2 – 1994 to 2015 Archetype Expanded Analysis, where each robot was categorized by archetype and sub-type. We will do this by using the expanded data in a similar fashion shown in Figure 3.3 – 1994 to 2015 Archetype Match-Up Analysis. By analyzing the sub-type match-ups from the data table and calculating the wins of each sub-type over the other an inter-meta-analysis of the sub-types were conducted. In order to present the results in an “easy to read” format, they are broken out by archetype.
STATIC META-ANALYSIS
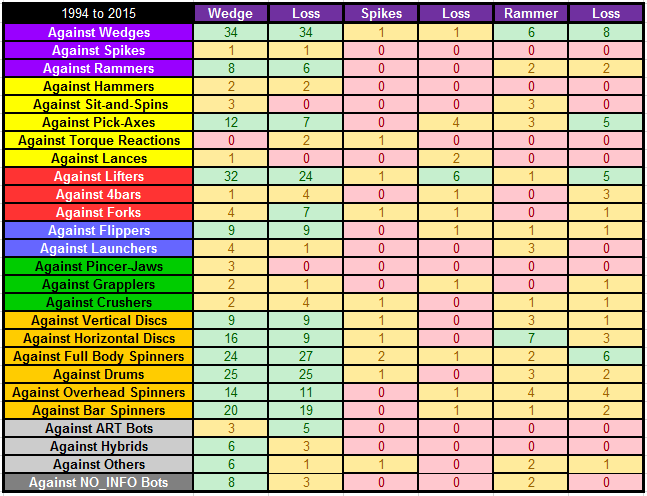
Below are the results of the STATIC meta-analysis for all collected match data which is comprised of 91 bots categorized as STATIC appearing in 584 matches. The table below provides the total wins and losses for each STATIC sub-type match-up, highlighting five+ wins in green and zero wins in red. In the table below the sub-type presented in the top row is the winner against the sub-type in the corresponding column.
Figure 5.1.A – STATIC Meta-Analysis
Summarizing the table above, the table below provides the win rate for each STATIC sub-type match-up, highlighting win rates above 60% in green, and highlighting win rates below 40% in red.
Figure 5.1.B – STATIC Meta-Analysis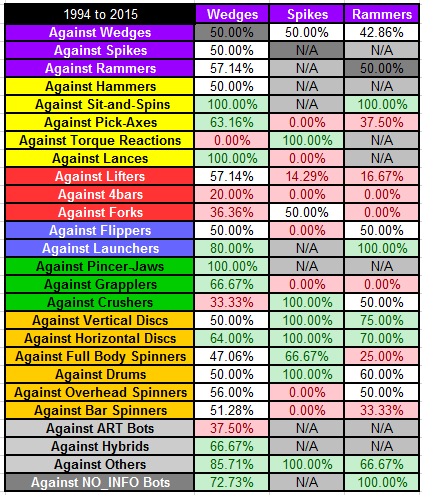
STRIKE META-ANALYSIS
Below are the results of the STRIKE meta-analysis for all collected match data which is comprised of 45 bots categorized as STRIKE appearing in 288 matches. The table below provides the win rate for each STRIKE sub-type match-up, highlighting five+ wins in green and zero wins in red. In the table below the sub-type presented in the top row is the winner against the sub-type in the corresponding column.
Figure 5.2.A – STRIKE Meta-Analysis

Summarizing the table above, the table below provides the win rate for each STRIKE sub-type match-up, highlighting win rates above 60% in green, and highlighting win rates below 40% in red.
Figure 5.2.B – STRIKE Meta-Analysis

LIFT AND FLIP META-ANALYSIS
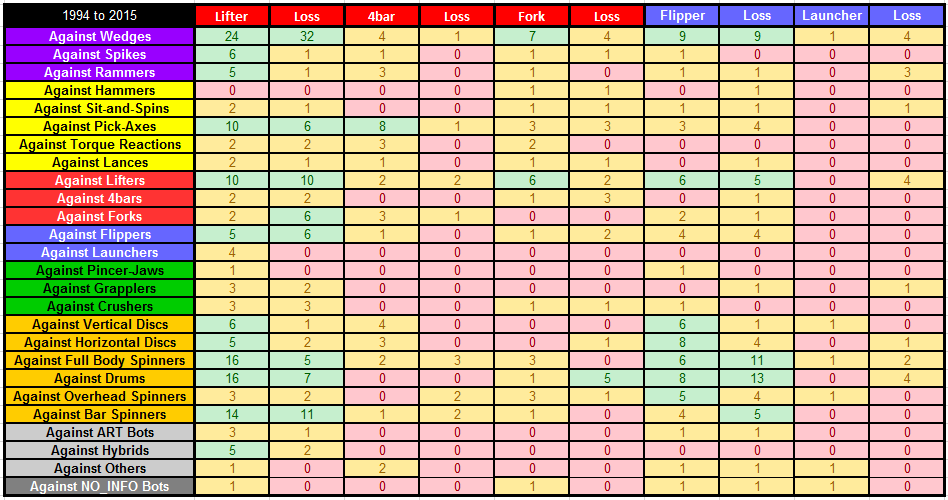
Below are the results of the LIFT and FLIP meta-analysis for all collected match data which is comprised of 36 bots categorized as LIFT appearing in 366 matches and 31 bots categorized as FLIP appearing in 165 matches. The table below provides the win rate for each of the LIFT and FLIP sub-type match-ups, highlighting five+ wins in green and zero wins in red. In the table below the sub-type presented in the top row is the winner against the sub-type in the corresponding column.
Figure 5.3.A – LIFT and FLIP Meta-Analysis
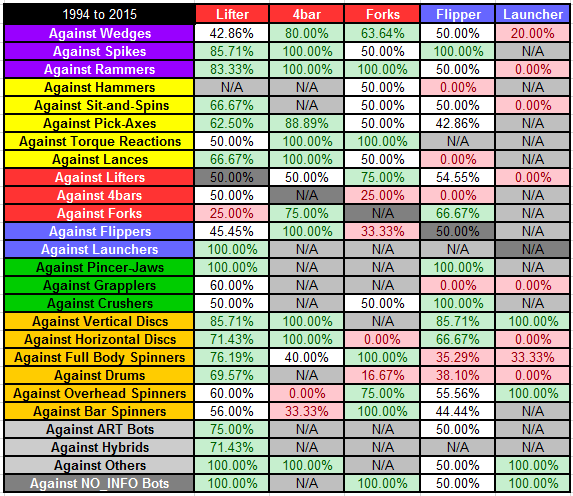
Summarizing the table above, the table below provides the win rate for each of the LIFT and FLIP sub-type match-ups, highlighting win rates above 60% in green, and highlighting win rates below 40% in red.
Figure 5.3 .B- LIFT and FLIP Meta-Analysis
GRIP META-ANALYSIS
Below are the results of the GRIP meta-analysis for all collected match data which is comprised of 22 bots categorized as GRIP appearing in 74 matches. The table below provides the win rate for each GRIP sub-type match-up, highlighting five+ wins in green and zero wins in red. In the table below the sub-type presented in the top row is the winner against the sub-type in the corresponding column.
Figure 5.4.A – GRIP Meta-Analysis

Summarizing the table above, the table below provides the win rate for each GRIP sub-type match-up, highlighting win rates above 60% in green, and highlighting win rates below 40% in red.
Figure 5.4.B – GRIP Meta-Analysis
SPIN META-ANALYSIS
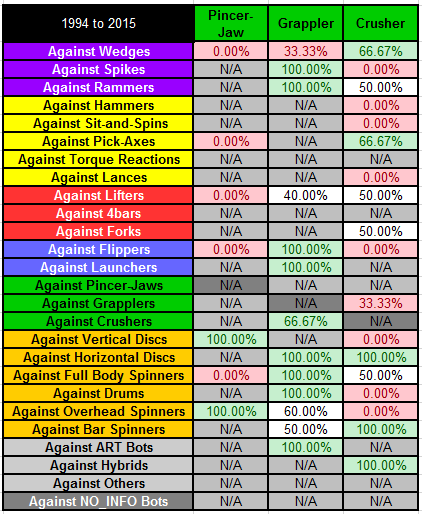
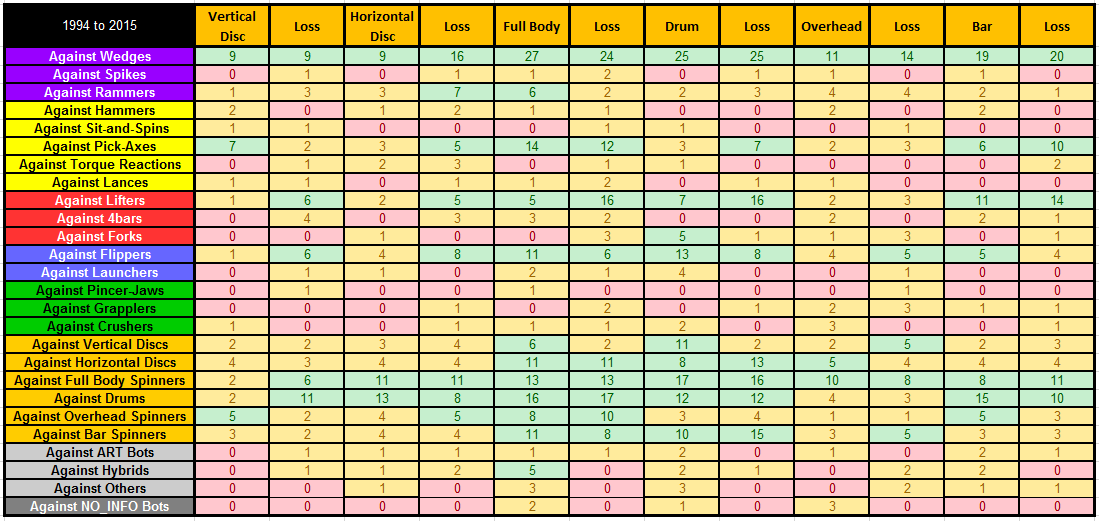
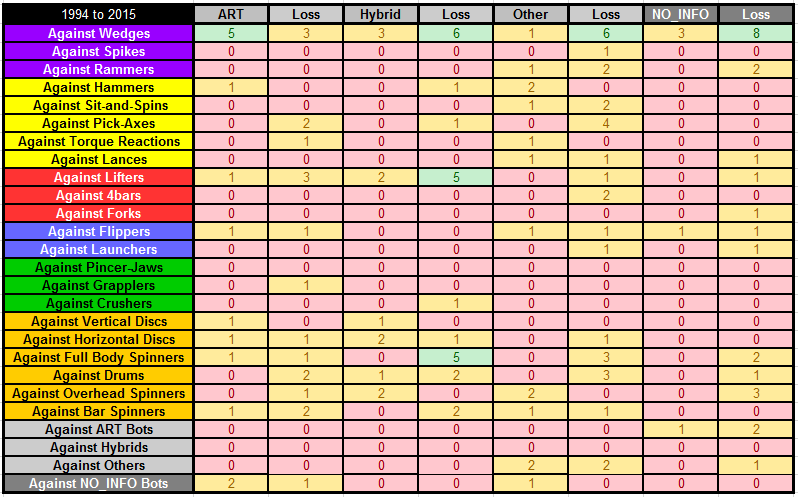
Below are the results of the SPIN meta-analysis for all collected match data which is comprised of 158 bots categorized as SPIN appearing in 1125 matches. The table below provides the win rate for each SPIN sub-type match-up, highlighting five+ wins in green and zero wins in red. In the table below the sub-type presented in the top row is the winner against the sub-type in the corresponding column.
Figure 5.5.A – SPIN Meta-Analysis
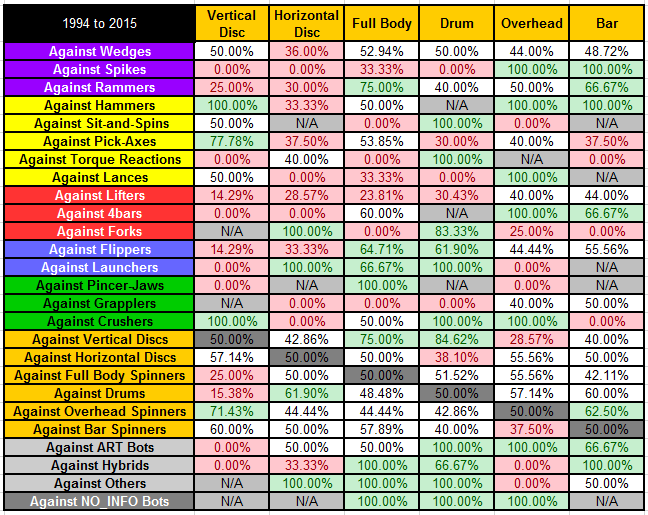
Summarizing the table above, the table below provides the win rate for each SPIN sub-type match-up, highlighting win rates above 60% in green, and highlighting win rates below 40% in red.
Figure 5.5.B – SPIN Meta-Analysis
OTHER META-ANALYSIS
Below are the results of the OTHER meta-analysis for all collected match data which is comprised of 54 bots categorized as OTHER appearing in 142 matches. The table below provides the win rate for each OTHER sub-type match-up, highlighting five+ wins in green and zero wins in red. In the table below the sub-type presented in the top row is the winner against the sub-type in the corresponding column.
Figure 5.6.A – OTHER Meta-Analysis
Summarizing the table above, the table below provides the win rate for each OTHER sub-type match-up, highlighting win rates above 60% in green, and highlighting win rates below 40% in red.
Figure 5.6.B – OTHER Meta-Analysis

SUMMARY
You want us to make some conclusions based on the above analysis, right? Well we are almost there, honestly, just use that beautiful brain of yours and draw a few of your own conclusions for now.
In our next article we will analyze match-ups by sub-type across different time periods, allowing us to begin to draw conclusions regarding historical trends in robot combat.
As always, feel free to join the conversation on our Facebook or Twitter with your questions, thoughts, and feedback on these articles! Also, please feel free to leave your additions, corrections, and musings in the comments section below!